The importance of international students in college and university finances
Let’s explore why a change in visa policies for international students could be devastating for colleges and universites.
When the Trump administration announced a policy that would rescind visas for international students whose institutions offered online-only courses in the fall, our immediate concern was the impact that could have on colleges and universites. Following a suit by Harvard, MIT, and other colleges and universities, the administration has reversed this policy, and online-only international students
will be permitted to stay in the US. However, there are still indications that international
enrollments are likely to decline significantly this fall.
Here we focus only on colleges and universities that offer bachelor’s degrees, and
approximately 7% of over 3.5 million students attending these schools are international. As
domestic enrollments suffer as well, the most selective colleges and universities
have an opportunity to draw students of all types to fill gaps, and the least selective
colleges and universities that traditionally enroll large percentages of international
students may suffer quite a bit. We’ve added an indication of overall financial standing, and
tuition dependence in particular, to gain an understanding of whether this fall’s
enrollment crisis could become an existential threat for schools unable to find
innovative solutions in this pandemic.
Impacts on schools
Use the selection to restrict the schools to specific classifications
and the US cartogram to filter by state.
Selecting a school will take you to the detailed school page.
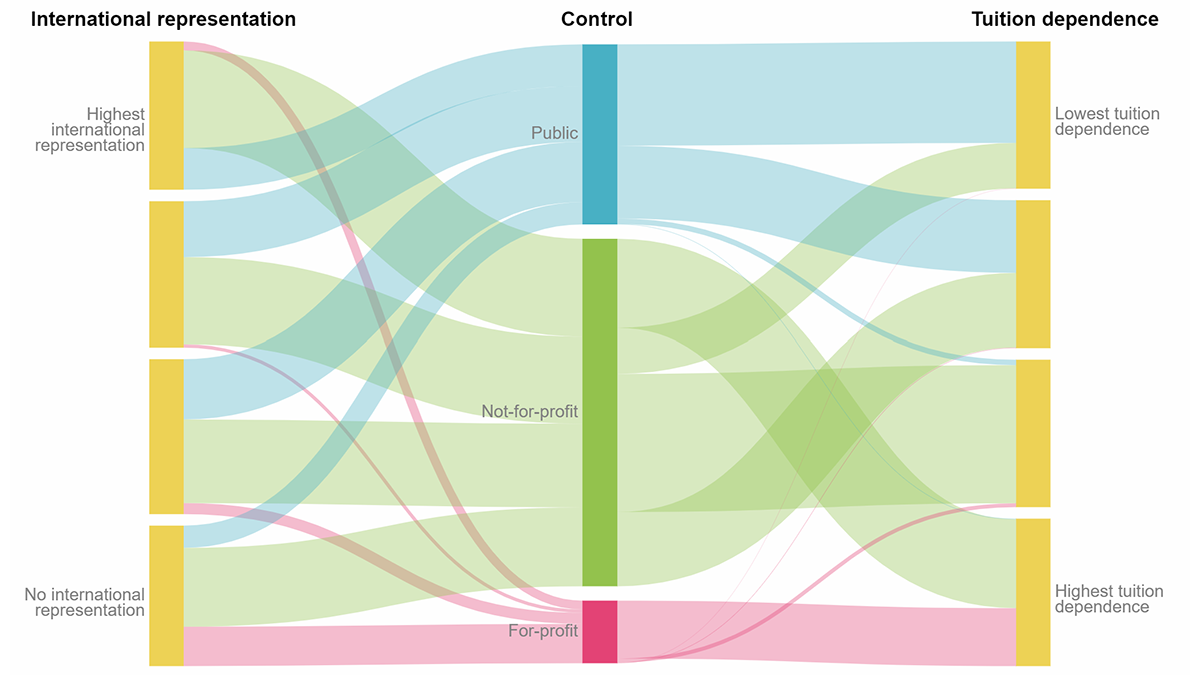
Which schools are most impacted by changes in international enrollment?
The private not-for-profit schools have the most risk
There are three types of institutional control. This chart shows the
control as the middle column, connected to the highest international
enrollment on the top-left and the lowest tuition-dependence on the
top-right.
Public colleges and
universities (blue ) typically receive significant funding from each state to
defray costs for its residents. International and out-of-state
students pay much higher tuition rates, and a large portion of public
colleges and universities enroll a large number of international students. However,
while a decline in full-tuition students
will translate to hardships, they will certainly survive this crisis.
Private for-profit (pink) institutions derive almost all operating costs from
tuition. They tend to enroll few international students, so their challenges
in the months ahead will be to maintain their typical enrollment in the
face of distancing requirements and the financial hardships that are
impacting their students.
The colleges and universities that will struggle with the loss of international student
enrollment are the private not-for-profit schools (green), many of which do depend on this
student group. From the ivy league schools to
the religiously-affiliated colleges and with many options in between, many
not-for-profits serve large international audiences that are typically
paying full tuition, while US students often benefit from “tuition discounting,” the
practice of offering liberal scholarships to increase the academic profile and
numbers of enrolled students. Many of these schools were already feeling the
crunch of demographic shifts in college-aged populations in the US, and COVID
will require true ingenuity and stamina for those without deep assets to survive.
Methodology
We modeled our financial health assessment on Forbe’s College Financial Health Grades. Financial
data is shared differently based on institutional control: public (blue ), private for-profit (pink), and
private not-for-profit (green). Their methodology is intended only for the latter, and we
wanted to assess the financial pressure on all institutions. We made a few modifications
to suggest viability more broadly, and we additionally do not share our results for
institutions that award fewer than 200 students annually. Smaller colleges tend to serve
niche audiences and the categories seem not to fit them as well.
Net assets per full-time-equivalent student (FTE) (15%):
What resources does an institution have to balance
its annual enrollment? Forbes measures the endowment per FTE, but
for-profit institutions do not have endowments. Even
with our change, a number of for-profit schools also
do not report net assets. In those cases, we give
our lowest rating for this metric, as well as the metrics
that rely on asset data.
Primary reserve ratio (15%): Could this institution’s core operating expenses be covered by its easily liquidated assets? This Forbes-recommended volatile ratio approximates the length of time that the school could function without revenue, and is calculated using a three-year average.
Core operating margin (10%):
Core revenues and expenses address each school’s primary
education mission, and are net of auxiliary and hospital revenues and expenses. We averaged performance over three years to minimize the impact of investment fluctuations.
The core operating margin is the percentage of the difference between core revenues and expenses
with respect to the core revenues.
Schools that are struggling have small or even negative core operating margins.
Tuition as a percentage of core revenues (20%) gives
a good approximation of the extent to which a school
is reliant on annual tuition for its operating budget. Those
that are tuition-driven are especially vulnerable to downturns in enrollment.
Net asset change (10%): This is the three-year average percentage change of net assets over the academic year, and provides a measure of the institution’s
financial stability prior to COVID.
Admissions yield (10%) is a measure of the likeliness
that a student who is admitted will then enroll. Along
with selectivity, this can be a measure of the ease of
capturing additional enrollments if needed.
Percentage of students receiving institutional grants (10%): This may be a particularly important figure
for schools with high percentages of international students. As this Forbes article details, international students typically pay much higher
tuition than US students, so a college or university
offering a high percentage of institutional scholarships may
not be able to attract US students who pay the
same tuition rates student-for-student.
Instructional expenditures per student (10%): The
most selective and prestigious colleges and universities
spend a tremendous amount on each student’s education,
and while this may strain the financial picture, it
correlates with an excellent education. If a school’s
expenses are going towards instruction, this improves
the financial health rating.
Our accreditation ratings are based on accreditation data released by the US Department
of Education. The ratings are defined as follows:
Best: Regional
accreditation with good standing and no recent probations or warnings from
accrediting agencies. Credits
earned in a regionally-accredited college or university are likely to by
accepted widely at other institutions.
Good: National
accreditation in good standing or any university with a recently removed
probation or warning. Credits earned are unlikely to transfer
to regionally-accredited institutions.
Fair:
Institutions that are currently on probation from their accrediting agency.
In creating the selectivity rating, we first calculated the percentile ranking in
comparison to all schools for the following metrics describing the most
recently reported entering class: high school GPA, 75th percentile of the
combined ERW and math SAT scores, 75th percentile of the composite ACT score. We
then averaged that percentile result
with the percentage of rejected applications.

 SOURCES: