When you’re beginning your search for colleges, you will encounter many “top lists” of schools. They’re a popular format and appear to give an idea of what schools you should consider. However, we don’t agree that they are all that useful. In most cases, they represent the very best of the best and the most exclusive schools, and for the vast majority of prospective students, those are simply not realistic choices.
To investigate this question, we took a look at a few different “top lists” of colleges (US News and World Report National Schools, Forbes, Wall Street Journal) and focused on the top 50 colleges in each of those lists. (Let’s be honest – just like you don’t ever look at the second page of Google searches, are you really going to scroll past more than 50 schools?) Using those results, we found a few key numbers.
First of all, the number of schools in these lists’ top 50 is a tiny percentage of all possible schools. The reality is that these lists are not representative of the actual available schools and their students represent only a tenth of the total students starting college in any given year.
Nearly 90% of the students going to college will be going to a school not near the top of those lists, and that’s largely because the lists don’t represent the majority of colleges as a whole.
Although the different sites making these lists may use different metrics to determine their top schools, the truth is that most of the good schools do everything well. A school like Harvard is going to show up in every list because it does well in virtually every possible metric related to determining a good school – but getting accepted there is certainly not possible for everyone.
So, when these lists share 52% of the schools they define as “top,” they aren’t really giving you any idea of what would be a good and attainable school for you.
In reality, a great many schools are at levels similar to these lists’ top 50 schools, but they don’t make it into the top 50 because they don’t fit that list’s specific criteria. If you only look at the top schools, you’ll never see these other options, but they’re just as good and are much more attainable for the average student.
For example, this chart shows bachelor’s-focused schools that have at an 80% graduation rate, along with a few other measures of success.
 SOURCES:
The lines in red are all in the top 50 of the lists previously mentioned – US News and World Report National Schools, Forbes Top Colleges, and Wall Street Journal Top US Colleges. The grey lines are schools not in the top 50 of one of those lists.
Creating a useful list
To this end, we’ve created a way with our school explorer to search for schools that allows you to determine what’s most important to you, and make a top list that is tailored to your own criteria.
When first starting to explore schools, you’ll see a list like this. Do any of those schools look familiar?

As in other lists, these are the best schools overall, but they are likely not the best school for you. So let’s fix that.
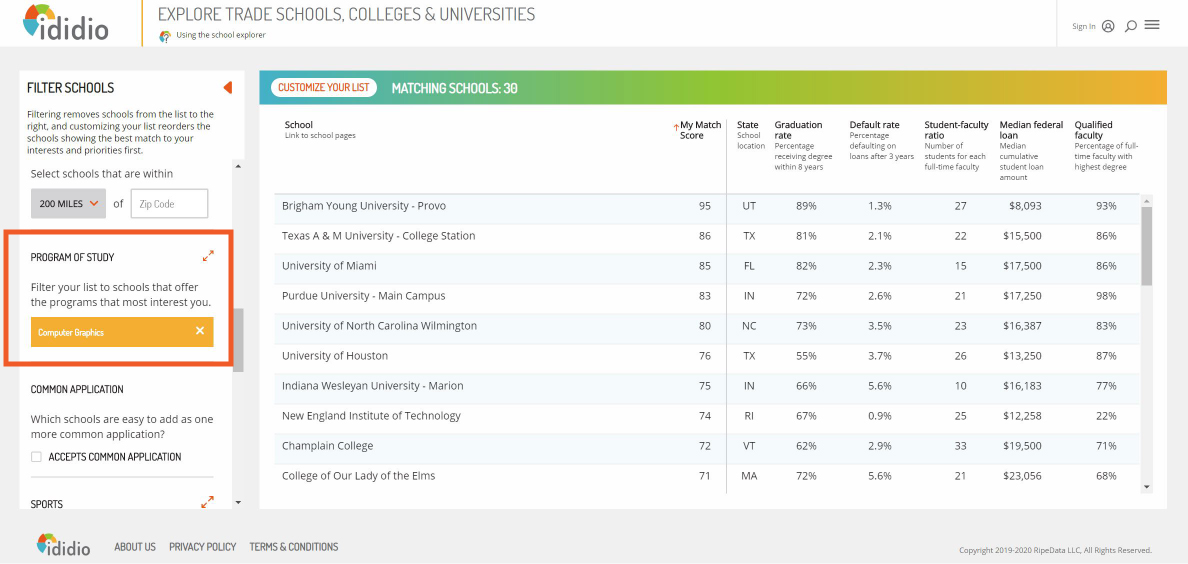
What if you knew that you wanted to major in something specific, let’s say computer graphics? After filtering for that, the top 10 schools look like this:
From there, you know that you want to live on campus, and ensure that there will be plenty of other students living on campus with you. Using the “customize your list” button, you can choose to mark that as being important to you, and then the list changes again:

Now you have a list of schools that closely fit your most important qualities in a school. This is certainly not the end of what you can do by adding and removing other filters. The “My Match” score will continually update as you make changes, and by default the list will sort by that score. As a result, you will always see the schools at the top of the list that will best fit you.

In this chart, we go even further. We add non-need-based aid as a metric, which indicates the amount of scholarship money the school is providing (this generally means they are offering you money to attend, and therefore want you as a student). This leaves you with a list of the schools that best fit what you want from a school, ordered with the best at the top. With our site, you have the ability to make a customized “Top 10” list of schools for yourself at any time!
SOURCES: